



Data Storytelling and Visualization in 2024: Critical Role in Digital Transformation!
Automatically translated
 Creator
People tell stories since they started to draw the first cave pictures. These stories are a powerful tool that we use to transfer information, share experiences and create our culture. In the same way, data blogging also utilizes the power of story expression to convey complex data meaningful and interesting.
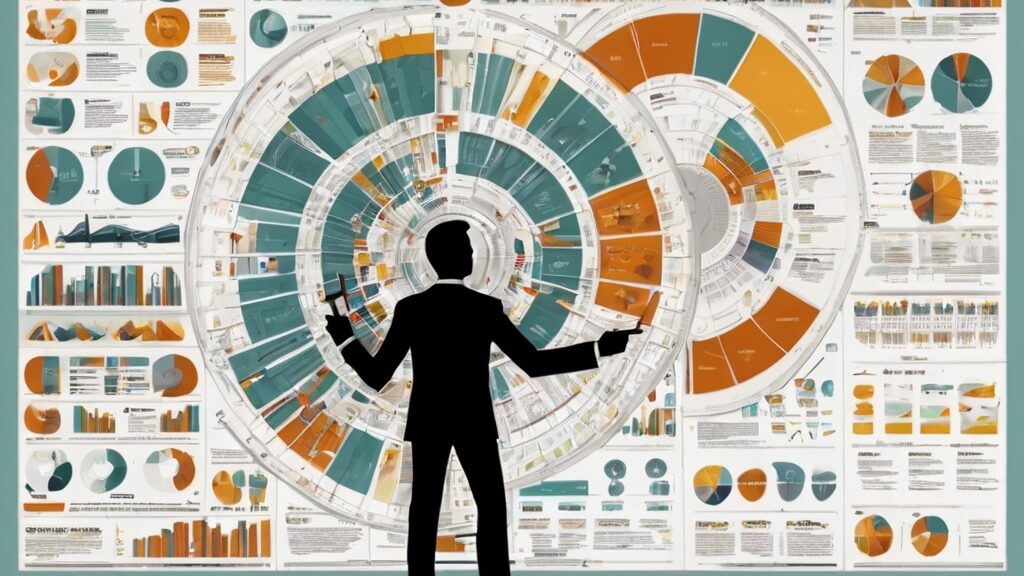
Data Storytelling: Telling Data
Just like our ancestors, we also have an innate trend to make sense of data and share them with others. Data blogging works by combining this natural trend, data visualization, using a simple language and creating an engaging narration. As a result, even complex analysis makes it easily understood and rememberable.
Digital transformation, an important concept from the other hand, has become a radically changing phenomenon of corporate companies. In the center of this transformation, large data and artificial intelligence are included. When data offers a great potential for businesses, it is necessary to analyze and present this data effectively. Here at this point, the data enters the programming and visualization. Data blogging ensures that data is presented in a context of a narration, and data visualization makes this data more understood by supporting visual tools.

What is Data Storytelling?
Data logging is to become a meaningful story of raw data. In this process, the data is presented in the context of a narration and transferred to the attention of the audience in an attractive format. This method, which facilitates the understanding of complex data sets, is important when strategic decisions for corporate companies. Data storytelling allows data to be just numerical values and communicate more effectively through a storytelling.
What Is Data Visualization?
Data visualization is presented using data graphic, table, map and other visual tools. This method makes it easier to understand large and complex data sets. With data visualization tools, when data is visually presented, it becomes easier for people to review and analyze data. It helps visually deliver data for managers and decision makers, making faster and effective decisions.
Latest Developments in Artificial Intelligence and Digital Transformation
As of 2024, the developments in AI and digital transformation have also affected data storytelling and visualization techniques. Artificial intelligence algorithms, It has become able to analyse large data sets faster and accurately. In this way, raw data to be used in the process of data blogging has become richer and meaningful. Also, machine learning algorithms integrate data visualization tools and create dynamic and interactive visuals.

Importance for Corporate Companies
Corporate companies need large data sets in daily operations and strategic decision-making processes. However, this data is not always easy to analyze and present significantly. Data storytelling and visualization offers great advantages to companies at this point. Here are a few titles why these techniques are important for corporate companies:
1. Strategic Decision Making
Data logging and visualization helps managers and decision makers make faster and accurate decisions. The data is understood and visually presented allows for easier interpretation of complex information. This allows companies to get strategic decisions based on data.
2. 2. Internal Communication and Cooperation
Providing large data sets in a clear way, increases in-house communication and collaboration. In particular, data sharing between different departments and joint work becomes more effective with data blogging and visualization techniques. In this way, a more compatible and efficient working environment is provided across the company.
3. Customer Relations and Marketing
Analyzing customer data and providing this data meaningfully contributes to the development of marketing strategies. Customer behavior and preferences are better understood and more effective marketing campaigns are created in light of this information.
4. Competitive Advantage
Data storytelling and visualization provide competitive advantage to companies. Companies who want to be a step ahead of their competitors, analyze their data more effectively and adapt faster to the dynamics of the market. This increases the competitiveness of companies.

Current Applications and Vehicles
In 2024, many innovative tools and applications were developed in the field of data blogging and visualization. These tools make companies’ data analysis processes more efficient. Here are some tools that stand out in this field:
Tableau: Tableau, leading in data visualization, stands out with user-friendly interface and strong visualization properties.
Power BI: Microsoft’s Power BI tool offers a wide range of solutions for data analysis and visualization.
D3. js: This library based on JavaScript is used to create customizable data visualizations.
QlikView: QlikView, used for data discovery and visualization, allows you to create interactive and dynamic visuals.
Google Data Studio: The free data visualization tool of Google allows users to quickly and easily visualize their data.
You can withdraw your interest: New Support of Google Cloud in Artificial Intelligence Distribution to Corporate Companies?
Data storytelling and visualization is critical for enterprise companies in digital transformation era. The developments in artificial intelligence and digital transformation allow these techniques to be used more and more effectively. Companies can offer their data more meaningful and effective using these techniques, they can take strategic decisions based on data. As a result, data logging and visualization stand out as a key power that provides competitive advantage for enterprise companies.
CreatorYapay Zeka ile Yeşeren Tarlalar: Akıllı Çiftçilik Devrimi


Yapay Zeka ile Tasarlanan Sentetik Kemikler Ortopedik Cerrahiyi Dönüştürmeye Hazır